Water
WATER
Some of our processes, especially dyeing, are intensive users of water. Many of our plants are in areas of water stress.
Ensuring that we are minimising the additional water stress that we are causing through our operations is important to other users and to the environment.
Why is Water Preservation Important?
Water is a precious resource and is coming under increasing pressure globally. Textile manufacturing, and especially dyeing processes, use significant volumes of water. We recognise our responsibility to use water as efficiently as possible to ensure that our water extraction activities create no negative impact on the local communities and biodiversity in the areas in which we operate. We are committed to minimising fresh water abstraction, and commit to reducing water consumption especially in areas of high water stress, and we strive to return the water we have used to the environment in a fit state for use by others.
“23% of our current sites are located in areas of ‘high or extremely high’ baseline water stress, and these sites are given high priority”
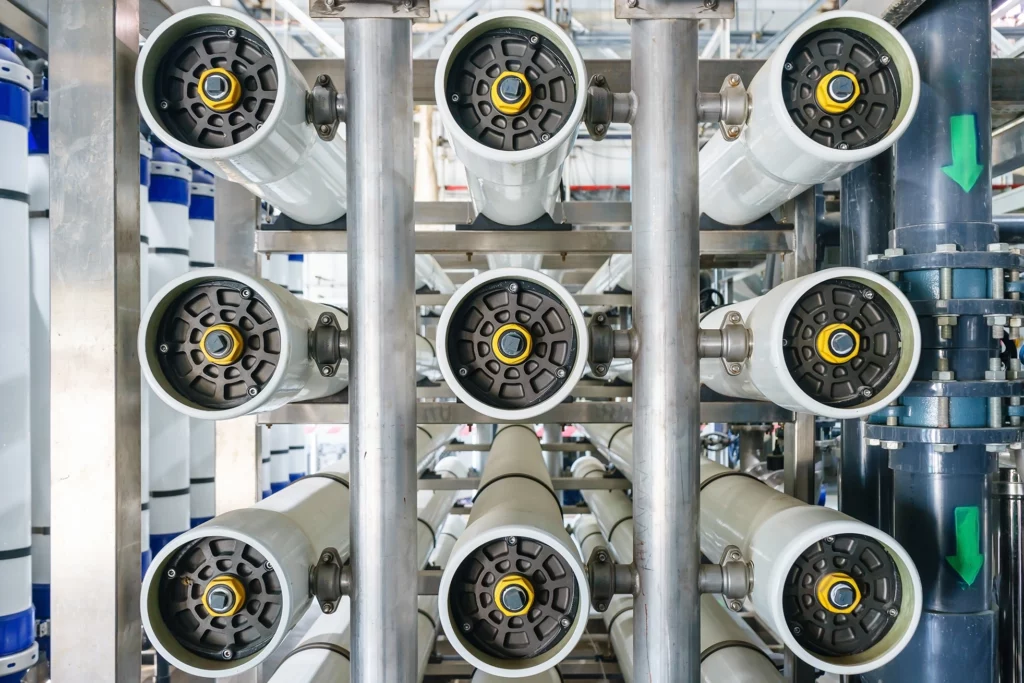
We have now set a target to deliver a 33% increase in the rate of water recycling by 2026, based on our 2022 baseline, and will focus on delivering this primarily in our sites located in medium and higher water stress locations. Delivery of this target rate of increase in water recycling will come from investments in reverse osmosis and ultra-filtration systems with capital investments planned for installation of these systems through the 2023 to 2026 time horizon.
Leak Remediation in Sevier

Inclusion of our Sevier site in our global ESG Utilities metering project in 2022, resulted in the installation of numerous smart water flow meters in different locations across the factory, with real-time data streamed into our cloud based Utilities management software. The additional granularity of data enabled the local ESG project team to develop significantly improved insights and understanding on where water losses were occurring across the facility and insight-led actions were planned and implemented to deliver significant water leak remediation, supporting an overall site level water intensity reduction of 29% in 2022 versus 2021.
“Availability and use of streamed data helped our continuous improvement teams quickly develop actionable insights which have underpinned significant reductions in site level water usage”
Emrah Bilgin, US Manufacturing Director
2022 Performance
New Chemistry for Cotton Hank Dyeing in India

Dyeing of cotton with reactive dyestuffs is known to be one of the most water intensive dyeing processes in the textile industry, requiring multiple dye bath fills and drains to deliver the required high brightness shades with the requisite levels of colour fastness. Our team in India identified an opportunity to transition their cotton hank dyeing processes onto new state of the art reactive dyeing technology and in this part of the business has delivered an 44% reduction in water intensity through the course of 2022.
44% REDUCTION IN HANK DYEING WATER INTENSITY
Managing Water Scarcity
As in previous years, using the World Resources Institute Aqueduct Water Risk Tools, we have assessed the overall water supply and demand situation for each of our manufacturing facilities and have classified each based on their location’s water stress with consideration given to water depletion and water table issues.
In 2022, 30% of our water consumption use was in areas with very high or high water stress levels (31% in 2021). A further 33% of our water is used in areas with medium water stress (34% in 2021). Our water recycling investments have previously been prioritised to units with very high water stress levels, where we recycle 42% of our water, compared to 25% globally.
Developing Technologies
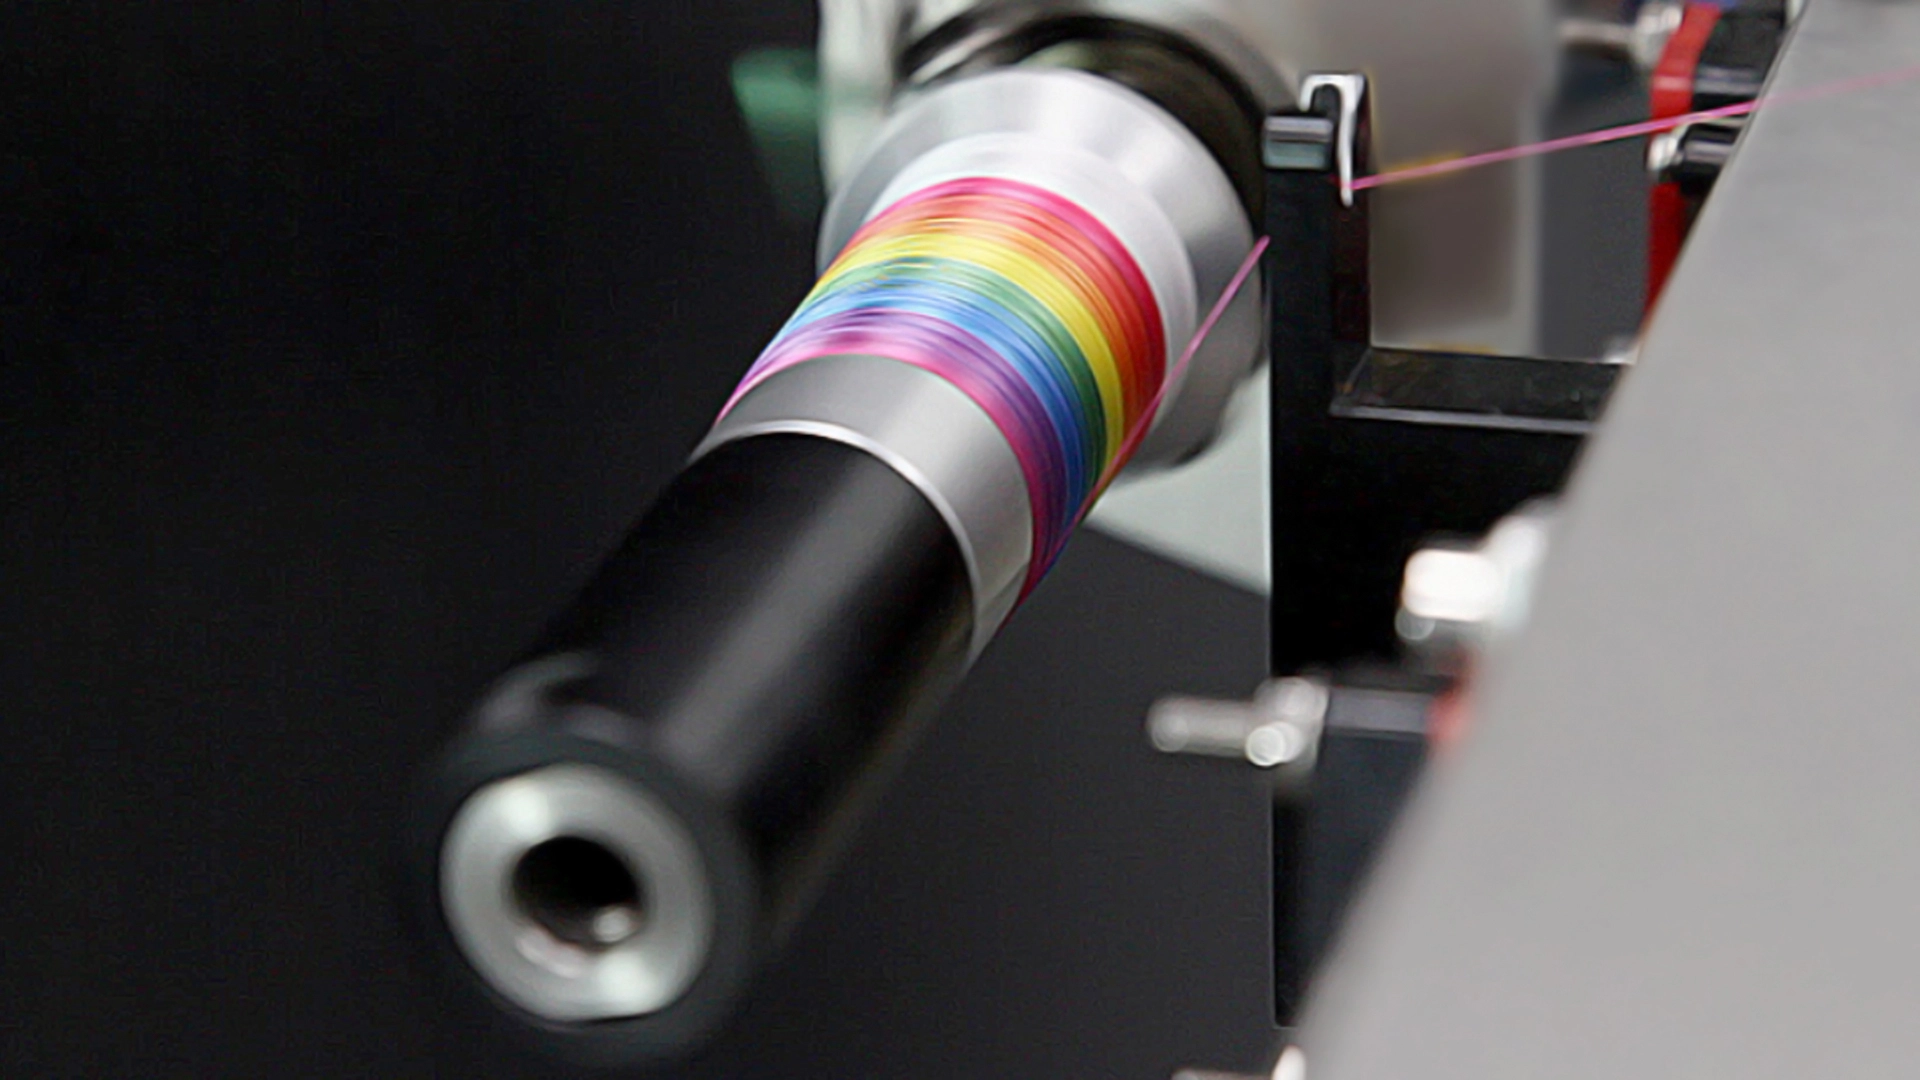
At the United Nations Climate Change Conference of the Parties (COP26) in November 2021, Coats committed to investing US$10m up to 2026 on scaling up the development of green technologies and materials across the industry. In 2023 we will allocate US$2m from this fund to support rollout of the Twine technology at selected apparel and footwear brands to support delivery of high speed, water free sampling.
Recognising that digital dyeing probably won’t be the only disruptive water free technology of the future, we continue to trial other options that may assist us to move away from water-based dyeing.
Water Process
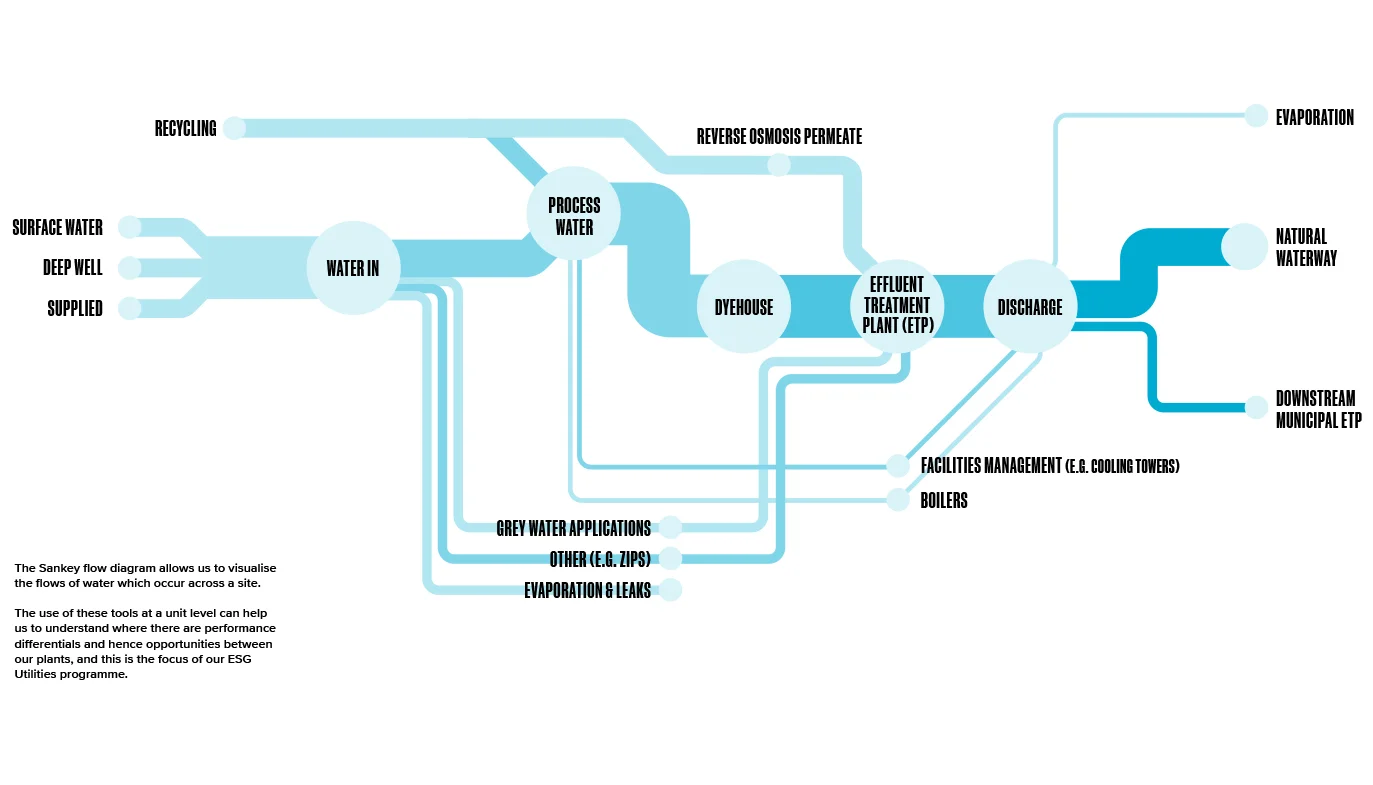
Further details on our water discharge processes can be found under our Waste Pillar where we recognise this as a material issue for stakeholders and continue our commitment to achievement of ‘Zero Discharge of Hazardous Waste’ (ZDHC) effluent standards.
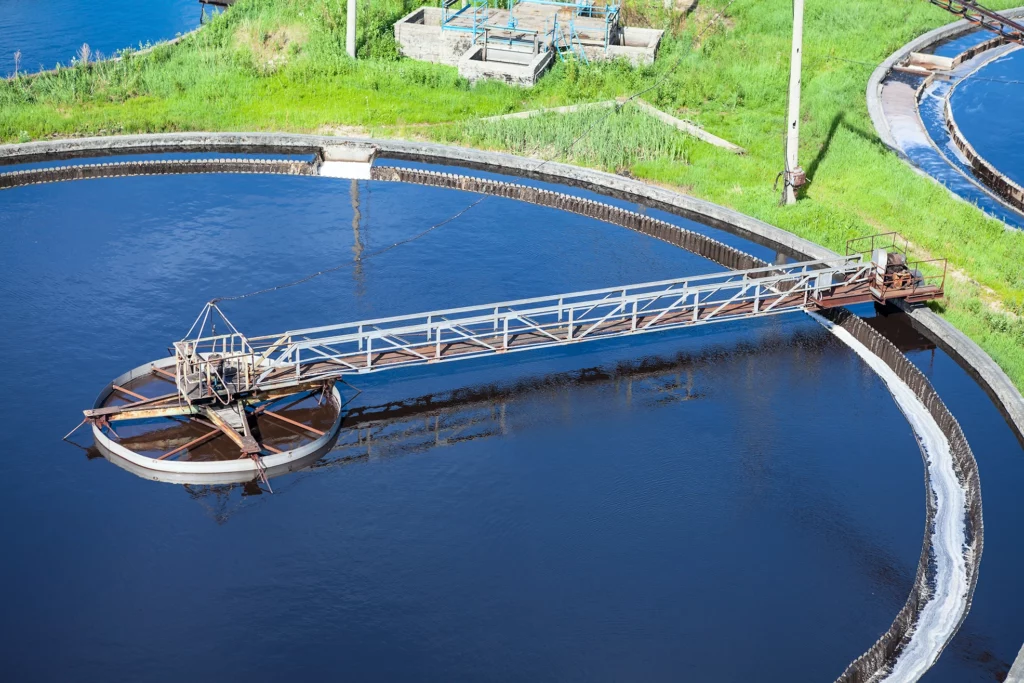
In our 2019-2022 strategy period, our priority focus has been on delivering significant reductions in water intensity, through elimination of wasteful or unnecessary uses, process re-engineering to reduce water use or reduction of the use of chemicals that can lead to degradation of water quality. Having delivered significant progress in this area, our priority will now align to increasing the rate of water recycling across our operations to further reduce “fresh water intensity”. Priority focus for this will be given to high and medium water stress locations as set out by the World Resources Institute Aqueduct Water Risk tools.
Water: 33% increase in recycling waste
|
Indicator
|
Unit | 2022* | 2021 restated1 | 2021 | 2020 restated1 | 2020 | 2019 restated1 | 2019 | 2018 restated1 | 2018 |
|---|---|---|---|---|---|---|---|---|---|---|
|
Total water used
|
Million cubic metres | 4.4 | 6.0 | 6.5 | 5.5 | 5.8 | 7.3 | 7.6 | 8.0 | 8.3 |
|
Water intensity |
Litres/kg produced | 52.5 | 64.5 | 67.0 | 73.5 | 76.0 | 80.3 | 83.0 | 85.2 | 86 |
|
Water intensity movement compared to 2018 |
% movement | -38% | -24% | -22% | -14% | -12% | -6% | -4% | ||
|
% of water recycled
|
% | 25% | 23% | 22% | 20% | 19% | 22% | 22% | 18% | 18% |
|
Withdrawal from municipal supply
|
Million cubic metres | 1.8 | 2.4 | 2.5 | 2.1 | 2.2 | 2.6 | 2.7 | 2.7 | 2.8 |
|
% water from municipal supply
|
% | 41% | 40% | 41% | 38% | 40% | 36% | 37% | 34% | 35% |
|
Withdrawal from ground water sources
|
Million cubic metres | 1.0 | 1.4 | 1.4 | 1.2 | 1.2 | 1.5 | 1.6 | 1.9 | 1.9 |
|
% of water from ground water sources
|
% | 23% | 23% | 23% | 22% | 22% | 21% | 21% | 24% | 23% |
|
Withdrawal from natural watercourses, reservoirs and rainwater harvesting
|
Million cubic metres | 0.5 | 0.8 | 1.0 | 1.1 | 1.2 | 1.5 | 1.4 | 1.9 | 1.6 |
|
% water from natural watercourses and reservoirs and rainwater harvesting |
% | 11% | 13% | 13% | 20% | 18% | 21% | 20% | 24% | 24% |
|
Total water withdrawal
|
Million cubic metres | 3.3 | 4.6 | 4.9 | 4.4 | 4.6 | 5.6 | 5.8 | 6.5 | 6.7 |
1Due to the sale of our Brazilian and Argentinian businesses in 2022 all years from 2018 to 2022 have been restated to exclude these businesses.
*2022 Data – All data excludes Brazil/Argentina, except emissions data, H&S data and economic value data.
For more information on our historical performance, please download Performance Summary Data
Water: 33% increase in recycling waste
|
Indicator
|
Unit | 2017 | 2016 | 2015 | 2014 |
|---|---|---|---|---|---|
|
Total water used
|
Million cubic metres | 7.9 | 8.2 | 8.3 | 8.3 |
|
Water intensity
|
Litres/kg produced | 112 | 118 | 121 | 127 |
|
% of water recycled
|
% | 11% | 8% | 4% | 2% |
|
Withdrawal from municipal supply
|
Million cubic metres | 3.0 | 3.1 | 3.2 | 3.3 |
|
% water from municipal supply |
% | 37% | 36% | 39% | 41% |
|
Withdrawal from ground water sources
|
Million cubic metres | 1.9 | 2.1 | 2.6 | 2.1 |
|
% of water from ground water sources
|
% | 24% | 27% | 26% | 27% |
|
% water from natural watercourses and reservoirs and rainwater harvesting
|
% | 28% | 28% | 30% | 30% |
|
Total water withdrawal
|
Million cubic metres | 7.1 | 7.5 | 8.3 | 8.0 |
For more information on our historical performance, please download Performance Summary Data


