Focus areas
Energy
Strategy Pillars
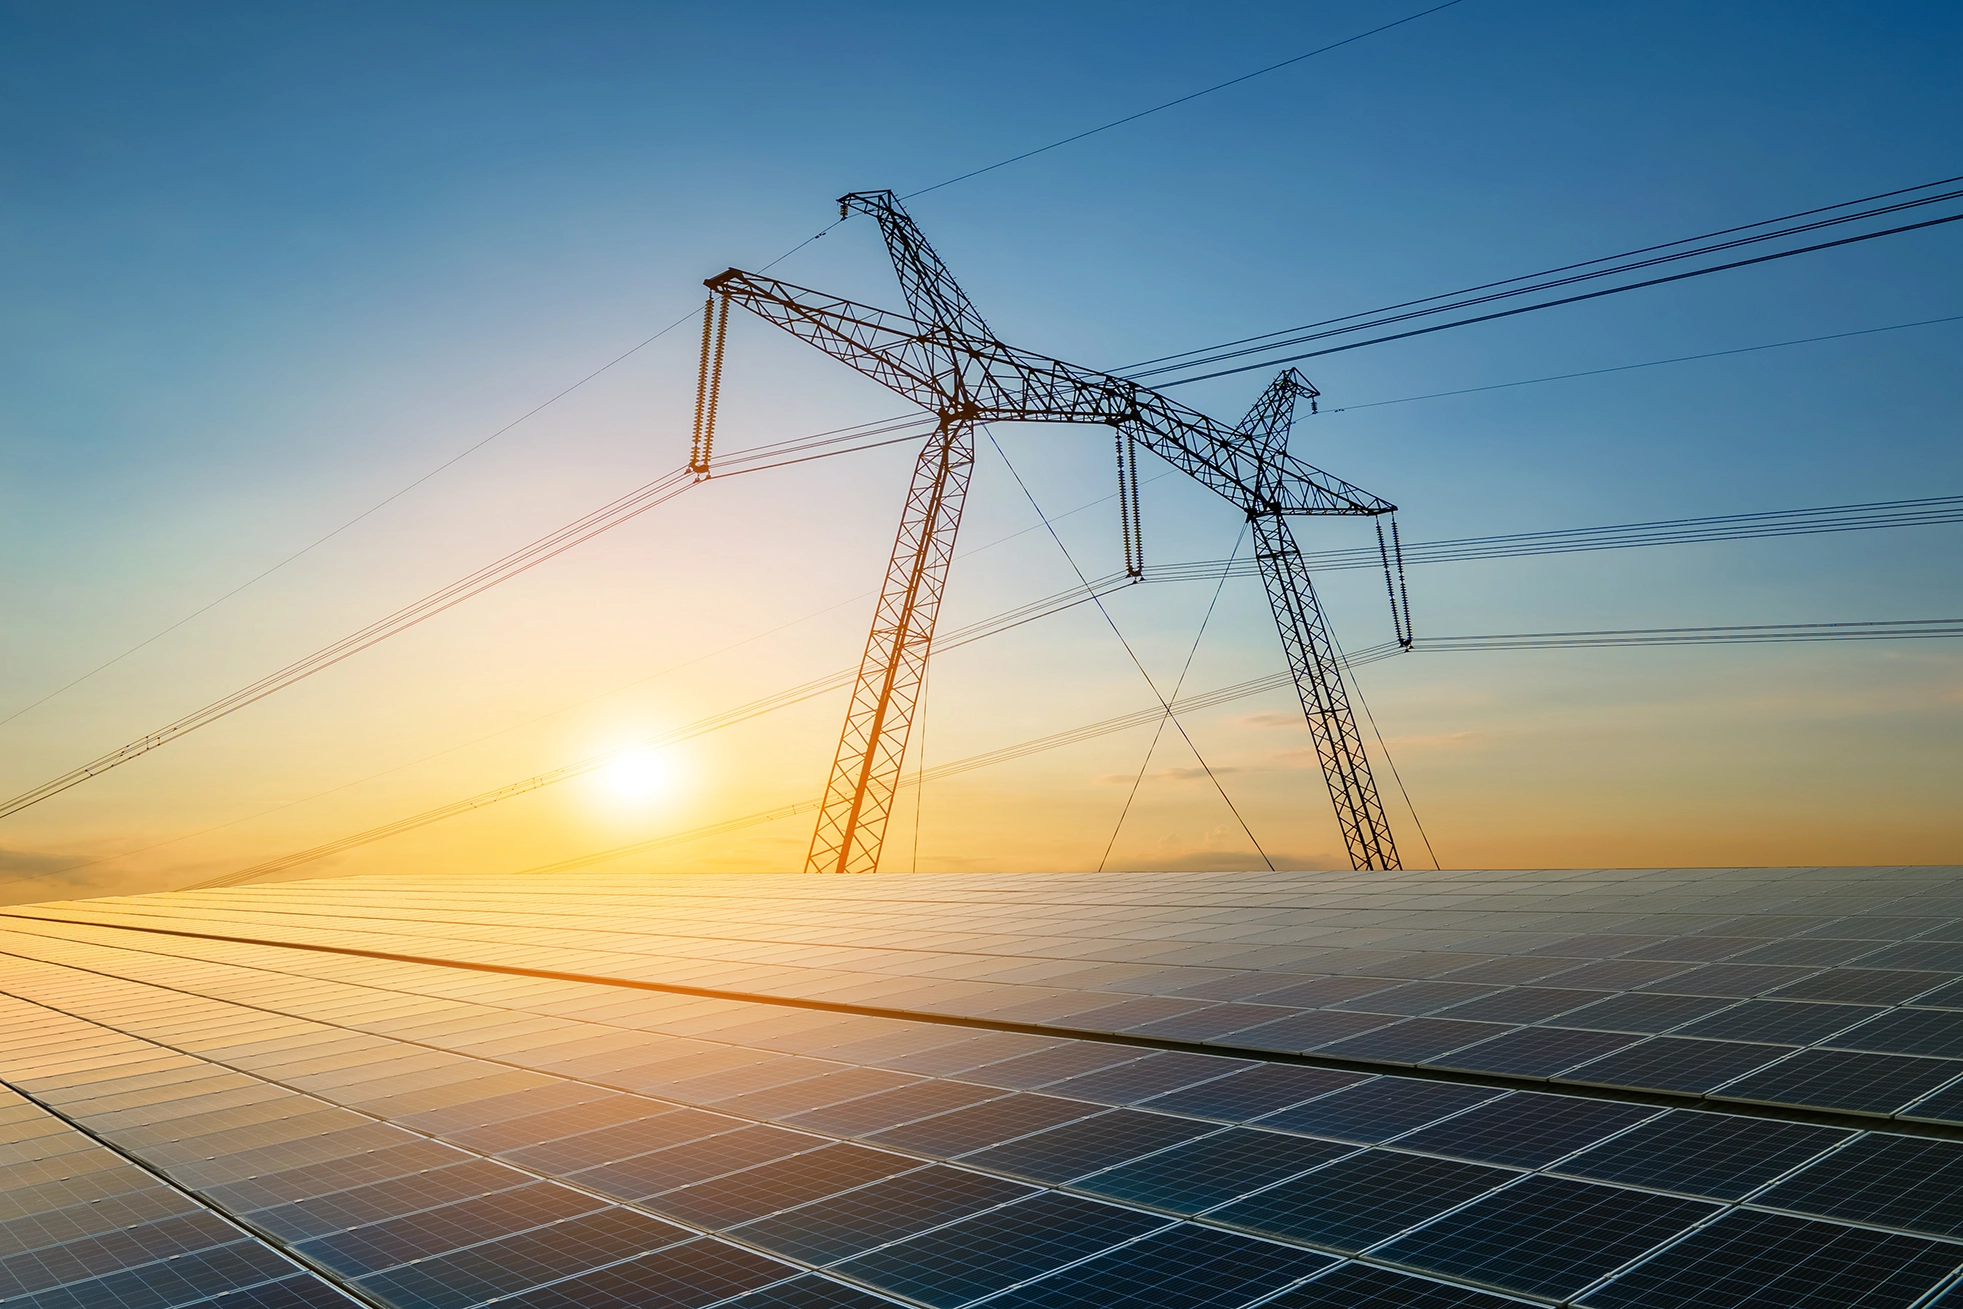
ENERGY
Our processes rely on energy, mainly for kinetic and thermal purposes. Our use of energy causes emissions of greenhouse gases that contribute to climate change. Reducing emissions through more efficient use of energy and using less emitting sources of energy is crucial to combat climate change.
Our Energy Profile
At Coats, we are committed to reducing our emissions in-line with the Paris Agreement aligned 1.5 pathway in order to play our part in minimising climate change risks. We are fully committed to delivery of a 46.2% absolute reduction in our Scope 1 and Scope 2 emissions by 2030, based on our 2019 emissions inventory, and our principle forward looking metric and targets for energy will therefore be directly linked to this. In pursuit of this commitment, our 2026 target for Scope 1 and Scope 2 emissions will be delivery of a 22% reduction based on our 2022 baseline.
We have committed that 70% of our energy will be renewable by 2030 and our roadmap for delivery of this target is primarily built on conversion of all of our electricity supplies to renewable sources, and to progressively convert our heat energy to electrical or other clean generation systems. Our strategy for energy transition rests on the principles of working with country level energy providers through new power purchase agreements (PPAs) to deliver additionality of renewable energy as a first priority, collaborating with existing renewable providers as a second option, and lastly, in the shorter term, compensating through purchase of Energy Attribute Certificates (EACs) to offset use of non-renewables. In 2022, we have increased the proportion of our electricity for which we have EAC coverage to 25%, with certificates either transferred directly from our supplier or purchased from the market.
Our PPAs will focus primarily on solar and wind power generation installations, both off and onsite. Due to the intensity of electricity used at a typical Coats plant, onsite rooftop solar sources can only generate a small percentage of the electricity demands.
We currently have on-site solar power generation installations in a number of our Indian, Vietnam and Bangladesh operations, with off-site wind power installations in India. We are in active discussions with energy providers in other markets, and are committed to expanding this approach in other locations through 2023.
In addition to transition to energy renewables, we will supplement our Carbon emissions reduction through further reductions in energy intensity, with further rollout of our ESG Utilities IoT metering program to more manufacturing units in 2023. Local manufacturing continuous improvement teams will continue to focus on new opportunities for energy intensity reduction. Having delivered a 10% reduction in energy intensity in 2022 on our 2018 baseline, we expect the rate of reduction of our energy intensity to decrease, however remain committed to delivery of a further 1% per annum through the 2023 to 2026 time horizon.
We continue to have one large manufacturing facility certified to the ISO 50001 international energy management systems standard and our policy is to align systems to this standard across other facilities, without pursuit of external certification unless there is a clear benefit to doing so.
Use of Smart Metering to Deliver Data Driven Insights and Actions on Energy

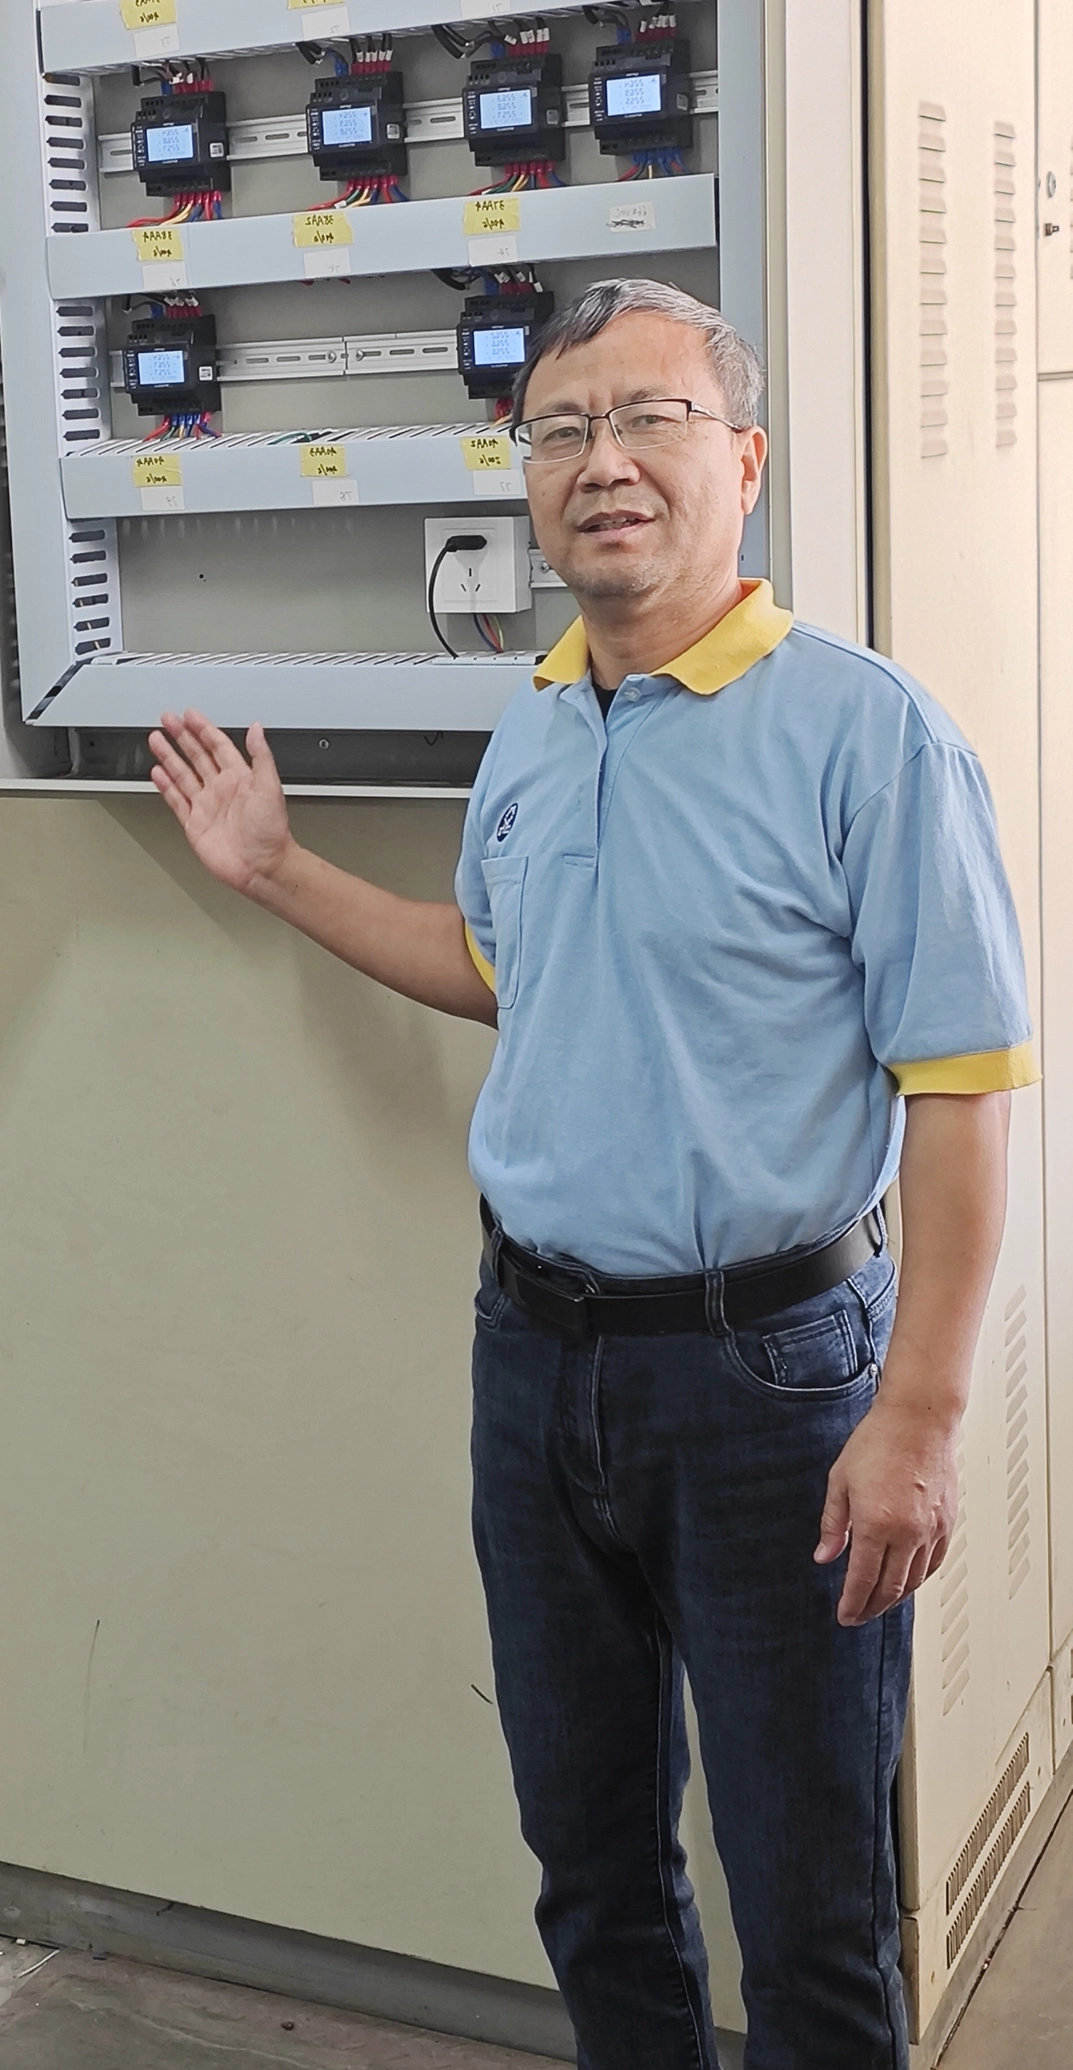 “As Engineering Manager of our Shenzhen
manufacturing facility in South China, I have led the
local ESG Utilities programme where we initiated
real-time streaming of energy data into a cloud
based platform. This has enabled us to much
better understand energy usage patterns and
identify previously hidden opportunities for delivery
of energy efficiency improvements.
“As Engineering Manager of our Shenzhen
manufacturing facility in South China, I have led the
local ESG Utilities programme where we initiated
real-time streaming of energy data into a cloud
based platform. This has enabled us to much
better understand energy usage patterns and
identify previously hidden opportunities for delivery
of energy efficiency improvements.
After our dyeing process, we dry the thread before processing into finished goods for sale to our customers. The drying process involves two stages; the first being water removal through a centrifugal extraction process, followed by a radiofrequency drying process where remaining water is driven off by targeting the vibrational wavelengths of remaining water molecules.
Using the streamed smart energy data from these
two processes, we were able for the first time to
review the entire drying process holistically, and
the new transparency enabled our Six Sigma
continuous improvement team to optimise the
overall process through nominal energy increases
in the centrifugal extraction process and significant
reductions in the radio-frequency process,
delivering a notable 15% end to end process energy
reduction. The additional transparency that has
come from increased granularity data has really
helped us identify new areas of opportunity.”
Pele Tang
Engineering Manager, Shenzhen
Coats Energy Profile
In 2022 we consumed 8.20 kWhr per Kg energy versus 9.09 kWHr per Kg in our 2018 baseline period for all business activities over which the company has operational control. This equates to a 10% reduction, significantly exceeding the 7% reduction in energy intensity we committed to delivering in this period.

Through 2022, as part of our global Cleaner and Lighter program, we further embedded our energy management platform with extended use of realtime smart energy meter data being streamed into our cloud based utilities management system. This new capability has enabled a far greater level of energy metering across operating units, giving heightened granularity and transparency of energy consumption at departmental, work centre and individual machine level and using data driven decision making has aided identification of new actionable insights to increase energy efficiency. Examples of improvement areas identified through this initiative were powering down of stand-by boilers, optimisation of frequency of air humidification systems in Spinning and Twisting operations, optimisation of compressed air and steam pressure and leak identification and remediation, campaigns to optimise asset utilisation in our thread bonding lines and optimisation of site level transformer loading. Across numerous facilities, we had active engagement from across the entire workforce with teams competing to identify and deliver energy reductions across production, dormitory and canteen facilities. Our Environmental and Climate Change Policies cover our energy and emissions aims and objectives.
Our Energy Basics program was extended in 2022 with best practice webinars delivered to provide training to relevant staff across all geographic locations, and this was supplemented with revised Standard Operating Procedures and support documentation to aid local manufacturing teams with enhanced knowledge and understanding of energy preservation opportunities.
Combining learnings from our ESG Utilities smart metering program and our Energy Basics program, we developed the “lift and shift” concept where insights, actions and resulting energy efficiency improvements in one manufacturing location were transferred to other manufacturing locations, achieving wider short term benefits without the need for extensive metering in the recipient sites.
As outlined in our Water Pillar, the further considerable reductions delivered in water intensity in 2022 have contributed to significant energy reductions; with dyeing being our most energy intensive process both for electrical energy to power the process but also for heat energy in the form of steam. Reductions in amount of water we use impacts positively through reduced heat energy requirements.
Energy: 22% reduction in Scopes 1&2 CO2e emissions
|
Indicator
|
Unit | 2022* | 2021 restated1 | 2021 | 2020 restated1 | 2020 | 2019 restated1 | 2019 | 2018 restated1 | 2018 |
|---|---|---|---|---|---|---|---|---|---|---|
|
Total energy used in operations
|
Million kWh | 692 | 792 | 801 | 661 | 670 | 826 | 831 | 858 | 865 |
|
Energy intensity
|
kWh/kg produced | 8.2 | 8.5 | 8.6 | 8.9 | 9.1 | 9.1 | 9.4 | 9.1 | 9.3 |
|
Energy intensity movement compared to 2018
|
% movement | -10% | -7% | -7% | -3% | -2% | 0% | 1% | ||
|
Non-renewable electricity used
|
% | 25% | 28% | 32% | 29% | 32% | 28% | 34% | 27% | 32% |
|
Natural gas used
|
% | 33% | 34% | 31% | 33% | 30% | 32% | 28% | 33% | 29% |
|
Oil used
|
% | 3% | 4% | 4% | 4% | 4% | 5% | 4% | 5% | 5% |
|
Coal used
|
% | 0% | 0% | 0% | 0% | 0% | 0% | 0% | 0% | 0% |
|
Renewable energy used
|
% | 38% | 34% | 34% | 34% | 33% | 35% | 34% | 34% | 34% |
|
% Electricity covered by renewable certificates
|
% | 25% | 7% | 7% | 8% | 6% | 7% | 5% | 5% | 3% |
|
Total carbon footprint,
Scopes 1, 2 & 3² |
Thousand tonnes CO2e | 985.2 | 1,157.0 | 900.7 | 1,123.1 | 303 | ||||
|
Scopes 1 & 2 footprint2
|
Thousand tonnes CO2e | 207.6 | 246.8 | 253.4 | 212.8 | 217.2 | 269.2 | 273.8 | 303.3 | |
|
Scope 1 emissions footprint³
|
Thousand tonnes CO2e | 50.0 | 58.2 | 62.7 | 48.7 | 51.3 | 62.26 | 64.6 | 67.1 | |
|
Scope 1 CO2 emissions
|
Tonnes CO2 | 48,585 | 56,925 | 60,106 | 46935 | 49,743 | 60789 | 63,153 | ||
|
Scope 1 CH4 emissions
|
Tonnes CH4 | 66.7 | 78.5 | 82.8 | 63.68 | 67.2 | 80.7 | 83.7 | ||
|
Scope 1 N2O emissions
|
Tonnes N2O | 52.7 | 56.6 | 58.4 | 45.86 | 47.3 | 75.2 | 76.6 | ||
|
Scope 1 HFCs emissions
|
Tonnes HFCs | 1,159.8 | 1,174.8 | 2,476.8 | 1470 | 1,494.5 | 1317 | 1,339.2 | ||
|
Scope 1 PFCs emissions
|
Tonnes PFCs | 0 | 0 | 0.0 | 0 | 0.0 | 0 | 0.0 | ||
|
Scope 1 SF6 emissions
|
Tonnes SF6 | 0 | 0 | 0.0 | 0 | 0.0 | 0 | 0.0 | ||
|
Scope 1 NF3 emissions
|
Tonnes NF3 | 0 | 0 | 0.0 | 0 | 0.0 | 0 | 0.0 | ||
|
Scope 2 emissions footprint (location based)⁴
|
Thousand tonnes CO2e | 195.8 | 213.9 | 216.1 | 184.3 | 186.2 | 232.9 | 235.3 | 236.2 | |
|
Scope 2 CO2 emissions
|
Tonnes CO2 | 194,754 | 212,741 | 214,905 | 183,278 | 185,116 | 231,625 | 233,974 | ||
|
Scope 2 CH4 emissions
|
Tonnes CH4 | 216 | 232 | 234 | 214 | 216 | 275 | 277 | ||
|
Scope 2 N2O emissions
|
Tonnes N2O | 815 | 944 | 948 | 829 | 833 | 1,043 | 1,047 | ||
|
Scope 2 emissions footprint (market based)⁵
|
Thousand tonnes CO2e | 157.6 | 188.6 | 190.7 | 164.1 | 165.9 | 206.9 | 209.2 | ||
|
Scope 2 CO2 emissions
|
Tonnes CO2 | 156,004 | 186,503 | 188,666 | 162,323 | 164,160 | 204,510 | 206,858 | ||
|
Scope 2 CH4 emissions
|
Tonnes CH4 | 114.6 | 126.6 | 128.7 | 128.1 | 129.9 | 153.8 | 155.8 | ||
|
Scope 2 N2O emissions
|
Tonnes N2O | 671.6 | 585.2 | 589.3 | 526.3 | 529.8 | 622.7 | 626.8 | ||
|
Out-of-scope biofuels, Scope 2 CO2 emissions
|
Tonnes CO2 | 19,900.0 | 32,789.0 | 32,789.0 | 26,960.0 | 26,960.0 | 38,163.0 | 38,163.0 | ||
|
% scope 2 emissions covered by renewable certificates
|
% | 25% | 8% | 7% | 6% | 6% | 5% | 5% | 4% | |
|
Emissions volume intensity (location based)
|
CO2e kg/kg production | 2.9 | 2.9 | 2.7 | 3.1 | 3.1 | 3.3 | 3.0 | 3.1 | |
|
Emissions value intensity (location based)
|
CO2e tonnes/$m sales | 154 | 188 | 176 | 209 | 202 | 223 | 185 | 192 | |
|
Scope 3 emissions footprint⁶
|
Thousand tonnes CO2e | 777.6 | 891.3 | 671.0 | 849.2 | |||||
|
Scope 3 CO2 emissions
|
Tonnes CO2 | 641,210 | 738,782 | 579,979 | 722,740 | |||||
|
Scope 3 CH4 emissions
|
Tonnes CH4 | 7,589 | 7,106 | 4,419 | 6,748 | |||||
|
Scope 3 N2O emissions
|
Tonnes N2O | 26,128 | 31,994 | 23,590 | 30,525 |
1Due to the sale of our Brazilian and Argentinian businesses in 2022 all years from 2018 to 2022 have been restated to exclude these businesses.
*2022 Data - All data excludes Brazil/Argentina, except emissions data, H&S data and economic value data.
2Total carbon footprint includes Scope 3 from 2019 and include market based Scope 2 from 2019. Prior years only include scopes 1 & 2 and location based for Scope 2. The boundary methodology for our emissions is based on financial control for all companies that are consolidated in the company financial statements and equity share for 2 joint venture operations.
3Scope 1 methodology - Fuel consumption data is collected from all units monthly, based on metred or invoiced consumption coverted into kWh. This is converted into emissions using DEFRA gross calorific value conversion factors published each year. This is then consolidated as per the boundary methodology.
4Scope 2 Location based methodology. Electricity or steam purchase volumes are collected from all units monthly in kWh. For location based calculations, all electricity kWhs are converted using IEA country level conversion factors for the year in question, and purchased steam or heating is converted using DEFRA conversion factors for the year in question. Data is then consolidated using the boundary methodology explained in note 2.
5Scope 2 Market based methodology. Electricity or steam purchase volumes are collected from all units monthly in kWh. For market based calculations, electricity kWhs that are covered by energy attribute certificates directly from suppliers or purchased on official markets are removed and the remainder are converted using supplier level conversion factors, if available or IEA country level conversion factors for the year in question. Purchased steam or heating is converted using DEFRA conversion factors for the year in question except for biogenic steam volumes where the CO₂ component of the emissions is removed and reported separately. Data is then consolidated using the boundary methodology explained in note 2.
6Scope 3 methodology. Scope 3 emissions are calculated annually using multiple sources for data (base activity data comes from internal data sources and conversion factors are generated from various sources, including suppliers, life cycle assessment data providers and industry data sources). The most critical data, covering primary raw materials, is largely sourced from suppliers. Each Scope 3 category is calculated with the best available set of data sources, and is consistent over the 3 reported years in this table.
For more information on our historical performance, please download Performance Summary Data
Energy: 22% reduction in Scopes 1&2 CO2e emissions
|
Indicator
|
Unit | 2017 | 2016 | 2015 | 2014 |
|---|---|---|---|---|---|
|
Total energy used in operations
|
Million kWh | 823 | 829 | 833 | 858 |
|
Energy intensity
|
kWh/kg produced | 11.5 | 11.9 | 12.2 | 13.2 |
|
Non-renewable electricity used
|
% | 29% | 30% | 32% | 31% |
|
Natural gas used
|
% | 34% | 35% | 33% | 33% |
|
Oil used
|
% | 7% | 6% | 6% | 11% |
|
Coal used
|
% | 0% | 0% | 0% | 0% |
|
Renewable energy used
|
% | 30% | 29% | 29% | 25% |
|
Total carbon footprint,
Scopes 1, 2 & 3² |
Thousand tonnes CO2e | 311 | 319 | 305 | 322 |
|
Scopes 1 & 2 footprint2
|
Thousand tonnes CO2e | 310.6 | 318.5 | 305.4 | 321.9 |
|
Scope 1 emissions footprint³
|
Thousand tonnes CO2e | 71.8 | 70.9 | 67.8 | 81.5 |
|
Scope 2 CO2 emissions
|
Tonnes CO2 | 238.8 | 247.6 | 237.6 | 240.4 |
|
Emissions volume intensity (location based)
|
CO2e kg/kg production | 4.3 | 4.6 | 4.5 | 4.9 |
|
Emissions value intensity (location based)
|
CO2e tonnes/$m sales | 206 | 219 | 208 | 210 |
1Due to the sale of our Brazilian and Argentinian businesses in 2022 all years from 2018 to 2022 have been restated to exclude these businesses.
*2022 Data - All data excludes Brazil/Argentina, except emissions data, H&S data and economic value data.
2Total carbon footprint includes Scope 3 from 2019 and include market based Scope 2 from 2019. Prior years only include scopes 1 & 2 and location based for Scope 2. The boundary methodology for our emissions is based on financial control for all companies that are consolidated in the company financial statements and equity share for 2 joint venture operations.
3Scope 1 methodology - Fuel consumption data is collected from all units monthly, based on metred or invoiced consumption coverted into kWh. This is converted into emissions using DEFRA gross calorific value conversion factors published each year. This is then consolidated as per the boundary methodology.
4Scope 2 Location based methodology. Electricity or steam purchase volumes are collected from all units monthly in kWh. For location based calculations, all electricity kWhs are converted using IEA country level conversion factors for the year in question, and purchased steam or heating is converted using DEFRA conversion factors for the year in question. Data is then consolidated using the boundary methodology explained in note 2.
For more information on our historical performance, please download Performance Summary Data