People
PEOPLE
Our employees, their families, our neighbouring communities and those in our wider value chain are all the people that are immediately touched by our business. We have a responsibility to them all and our policies, procedures and programmes are there to ensure that safety, wellbeing, fairness, equality, diversity and opportunity are part of that relationship.
Great starts here

Diversity, Equity and Inclusion

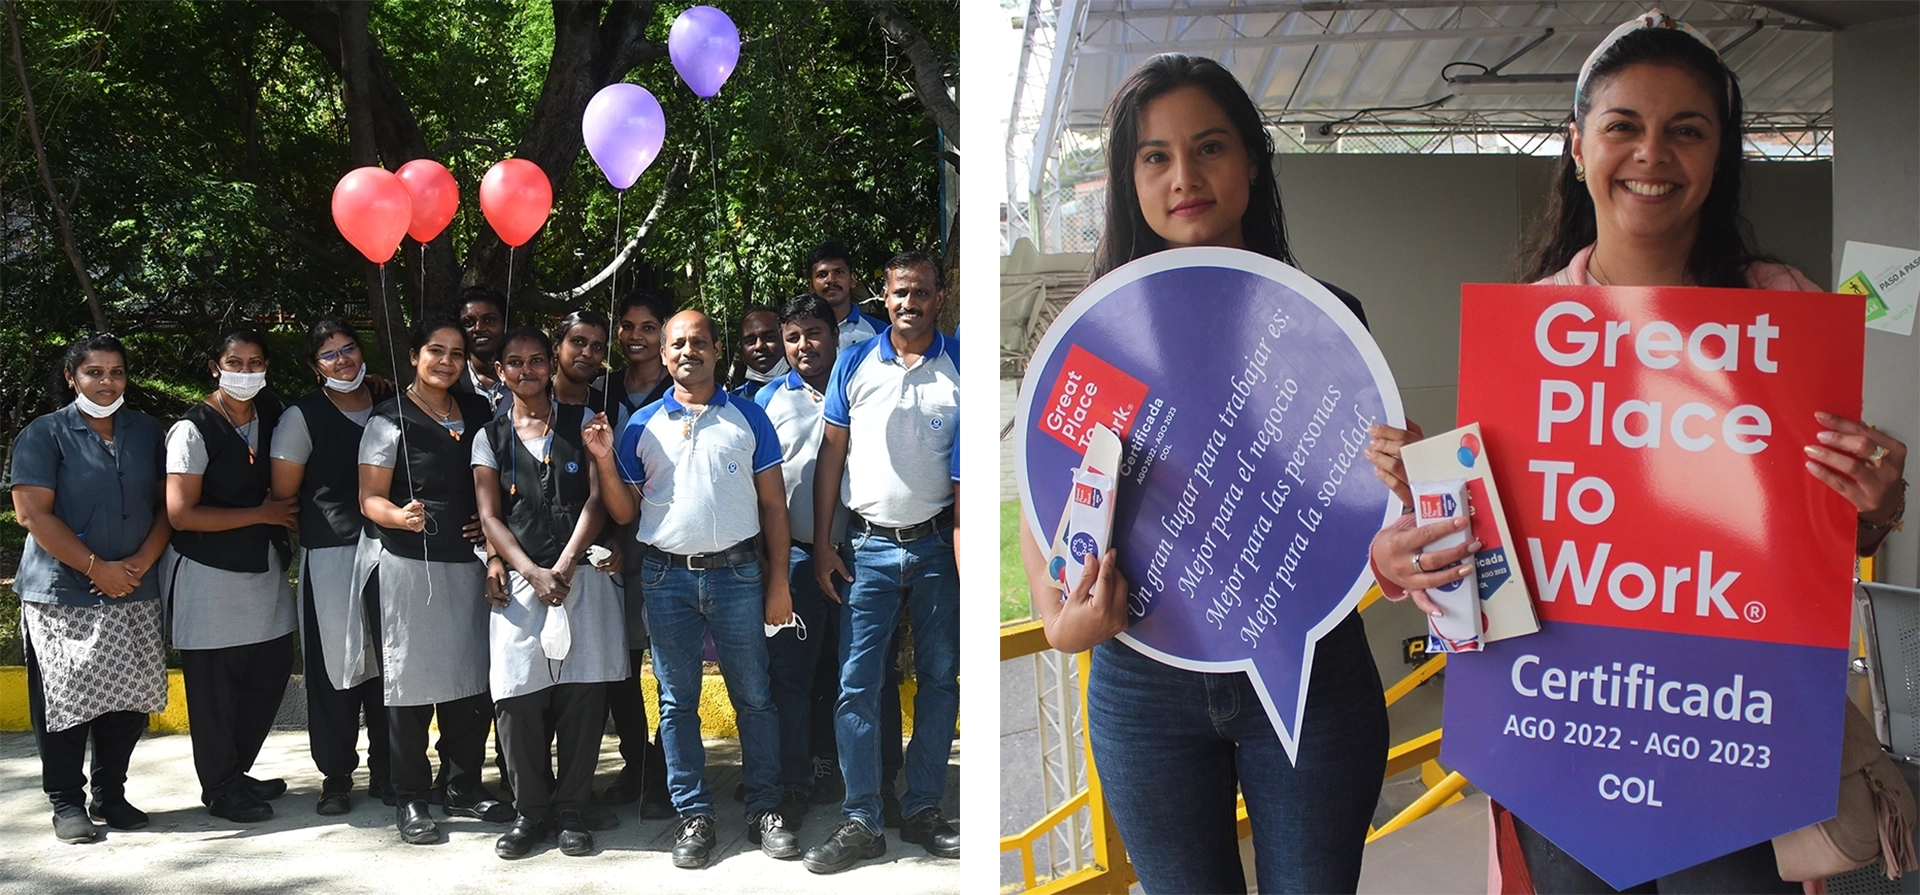
Everyone, regardless of race, ethnicity, nationality, gender, age, social background, disability, pregnancy or maternity, sexual orientation, marriage or civil partnership, education, beliefs and political opinion, must be treated fairly and with respect. “Coats for All” approach ensures we apply consistent global practices and provide a positive employee experience not for a few, not for many, but for all members of our teams, no matter who they are, where they work or what they do for the organisation.
At a global level we employ people from over 60 nationalities and our gender balance is 35:65 female to male. At a Board level we have 6 nationalities and a gender balance of 44:56 female to male, meeting the Hampton Alexander Review and Financial Conduct Authority targets for female representation at Board level. Our Executive Management team has a gender balance of 29:71 female to male. Our goal is to improve gender diversity at all management levels with a particular focus on senior management levels where our balance at the end of 2022 is 21:79 female to male.
During 2022, the proportion of female senior managers has dropped as a result of strategic projects undertaken during the year and the impact of the new acquisitions made in the year. To accelerate the pace of gender equity at Coats, a female employee-focused programme was developed and launched in late 2022. Our “Coats for Her” programme sits under our umbrella “Coats for All” programme and encourages more women to consider a career with us and nurtures our female talent through five key initiatives: Female Recruitment Campaign, Women in Leadership Fast-Track Programme, Mentoring, Women’s Visibility and Return to Work Programme.
Occupational Safety

Our ‘Journey to Zero’ was launched in 2018 and continues to be at the heart of our business strategy. The focus of this programme is firmly on ‘leading’ measures that we take to ensure that safety behaviour, training and hazard identification are embedded in our daily business practices. 6 sites globally are covered by ISO 45001, ISO standard for management systems of occupational health and safety (OHS).
Leading measures are those which are aimed at identifying and reducing hazards, and improving safety related behaviour, and lagging indicators are incident rates and their outcomes, such as lost days.
Obviously the ultimate measure of success for this is consistent reduction in our ‘lagging’ indicators and primarily in our Lost Time Incident Rate (LTIR). At 0.4 (incidents per 100 employees) our LTIR is already significantly below equivalent textile industry rates (latest US rates are 1.9). The LTIR rate has increased as a result of our acquisitions in 2022 and improving the performance in these businesses is our current highest priority. We will also be continuing the focus we have on commuting safety as we continue to find that our employees’ journey to and from work is a significant hazard in many countries.
Our Richtlinie zu Gesundheit und Sicherheit is available and is underpinned by a full suite of sub-policies and procedures which are rigorously applied across all Coats units and which are incorporated into our digital workflows in our Intelex Health and Safety cloud based reporting system. Health and Safety reports on leading and lagging indicators are made to every Board meeting which are scheduled at least 7 times per year.
Health & Wellbeing

Coats is committed to the wellbeing of all employees, acknowledges workplace mental health as an important issue for the business and its employees, and takes a stand for employee wellbeing. Coats Board and senior management are committed to promoting mental health in the workplace.
Through our ‘Energy4Performance’ strategy we are seeking to ensure that our employees’ health and wellbeing is supported through structured programmes covering physical, mental, emotional and personal zones. We have a long history of providing such interventions, and our new strategy builds on and enhances this.
Our Energy4Performance strategy provide a healthpromoting workplace which aims to cover the following aspects:
Health-related opportunities and risks being identified and regularly assessed
Increased Employee awareness about the benefits of a healthy lifestyle
Our Mental Health and Wellbeing Statement can be accessed at download centre
Ethics
We have an Anti-Bribery and Anti-Corruption Policy, a Data Breach Notification Policy, a Data Protection Policy, a Whistleblowing Policy and an Anti-Retaliation sub-policy.

We have a comprehensive multi-language suite of mandatory compliance trainings covering Ethics at Work, Antibribery, Competition Law and Anti Slavery that are completed by all relevant employees on a biennial basis, and by all new starters. This training was scheduled across the business in 2022, with over 2,500 employees participating and undertaking short post training examinations to prove understanding. We continue to promote open discussions around the importance of ethics through pursuit of our global ‘Doing the right thing’ programme, led by members of senior management.
“To ensure our high ethical standards are embedded across our supply chain, we make it our responsibility to provide our employees with the correct tools and training to achieve”

All of these indices were updated in 2020 or 2021 except for the last one where the data has not been updated since 2018. We factor all of these indices by normalising them and weighting them all equally to produce a final score for each country in which we operate and then we apply the employee numbers to weight those scores into a global total. In our latest calculations the analysis is showing a deterioration in the external environment risk level in a number of countries in the Americas and Asia. By drilling into the detail we have identified that the bulk of this deterioration is driven by worse country level child labour risk ratings and is caused by the filling of gaps in the Unicef data sets as they improve their access to reliable data. This indicates that the overall risk level in these countries might not have actually deteriorated in the last two years, but that we are more accurately measuring the risk. We police employee age very rigorously and have had no cases of underage employment in our operations.
Nevertheless, this continues to highlight the necessity to ensure very robust application of the policies and procedures that we have in place to ensure that child labour, modern slavery, and human rights violations do not occur in our operations and that where legally permissible, freedom of association and access to collective bargaining are open to all our employees. This will be revisited in 2023.
Following our earlier work on ‘living wage’ analysis across all our units, we completed the small amount of remedial action necessary to ensure that all employees met this benchmark. Our Living Wage Policy which describes our approach is available to download from our website. In addition, our membership of the Fair Wage Network, provides a source of information for our annual remuneration assessments.

We aspire for all our suppliers to be fully compliant with Coats’ health and safety, labour and environmental standards, and will increasingly transfer our operational standards into firm targets for our suppliers. Having updated our Supplier Code in 2020 we have continued our programme of audits that are targeted at suppliers that have a high risk profile. We have implemented a system through Bureau Veritas that tailors audit frequency to supplier performance in the audit, with supplier’s rated good visited every 3 years. Since we started this programme in 2021, 322 audits have been completed with 92% being rated good or acceptable. Of the 8% where improvement is required, or significant risks have been identified, there are 3 suppliers where we are currently requiring urgent amendments to their practices, and if these are not completed we will delist the supplier.
Prior to qualification of a new supplier, and on an annual basis thereafter, all suppliers are required to make a declaration that all materials supplied by them will be fully compliant with Coats Materials Restricted Substances List (CMRSL). The CMRSL is reviewed and updated on an annual basis and aligns to the strictest standards of all of our customers.
Our Whistleblowing Policy has been updated in 2022. In 2022, we transitioned from an internally managed whistleblowing hotline to an external web-based channel to give our employees greater confidence that the process is secure and independent. As well as internal options for whistleblowing, we have 2 external options for whistle blowers to use; a confidential external voicemail system and a confidential multi-language external web-based reporting system. Our Whistleblowing Hotline has continued to provide support to our employees and received 91 incidents (compared to 98 in 2021). Of the investigations that have been completed 18 [20%] have been upheld (versus 30% in 2021).
Career Management, Training and Mentoring

Coats Cares
Pakistan
Flooding

Mexico
Save the children

Bangladesh
Book donation and tree plantation program for school children

Sri Lanka
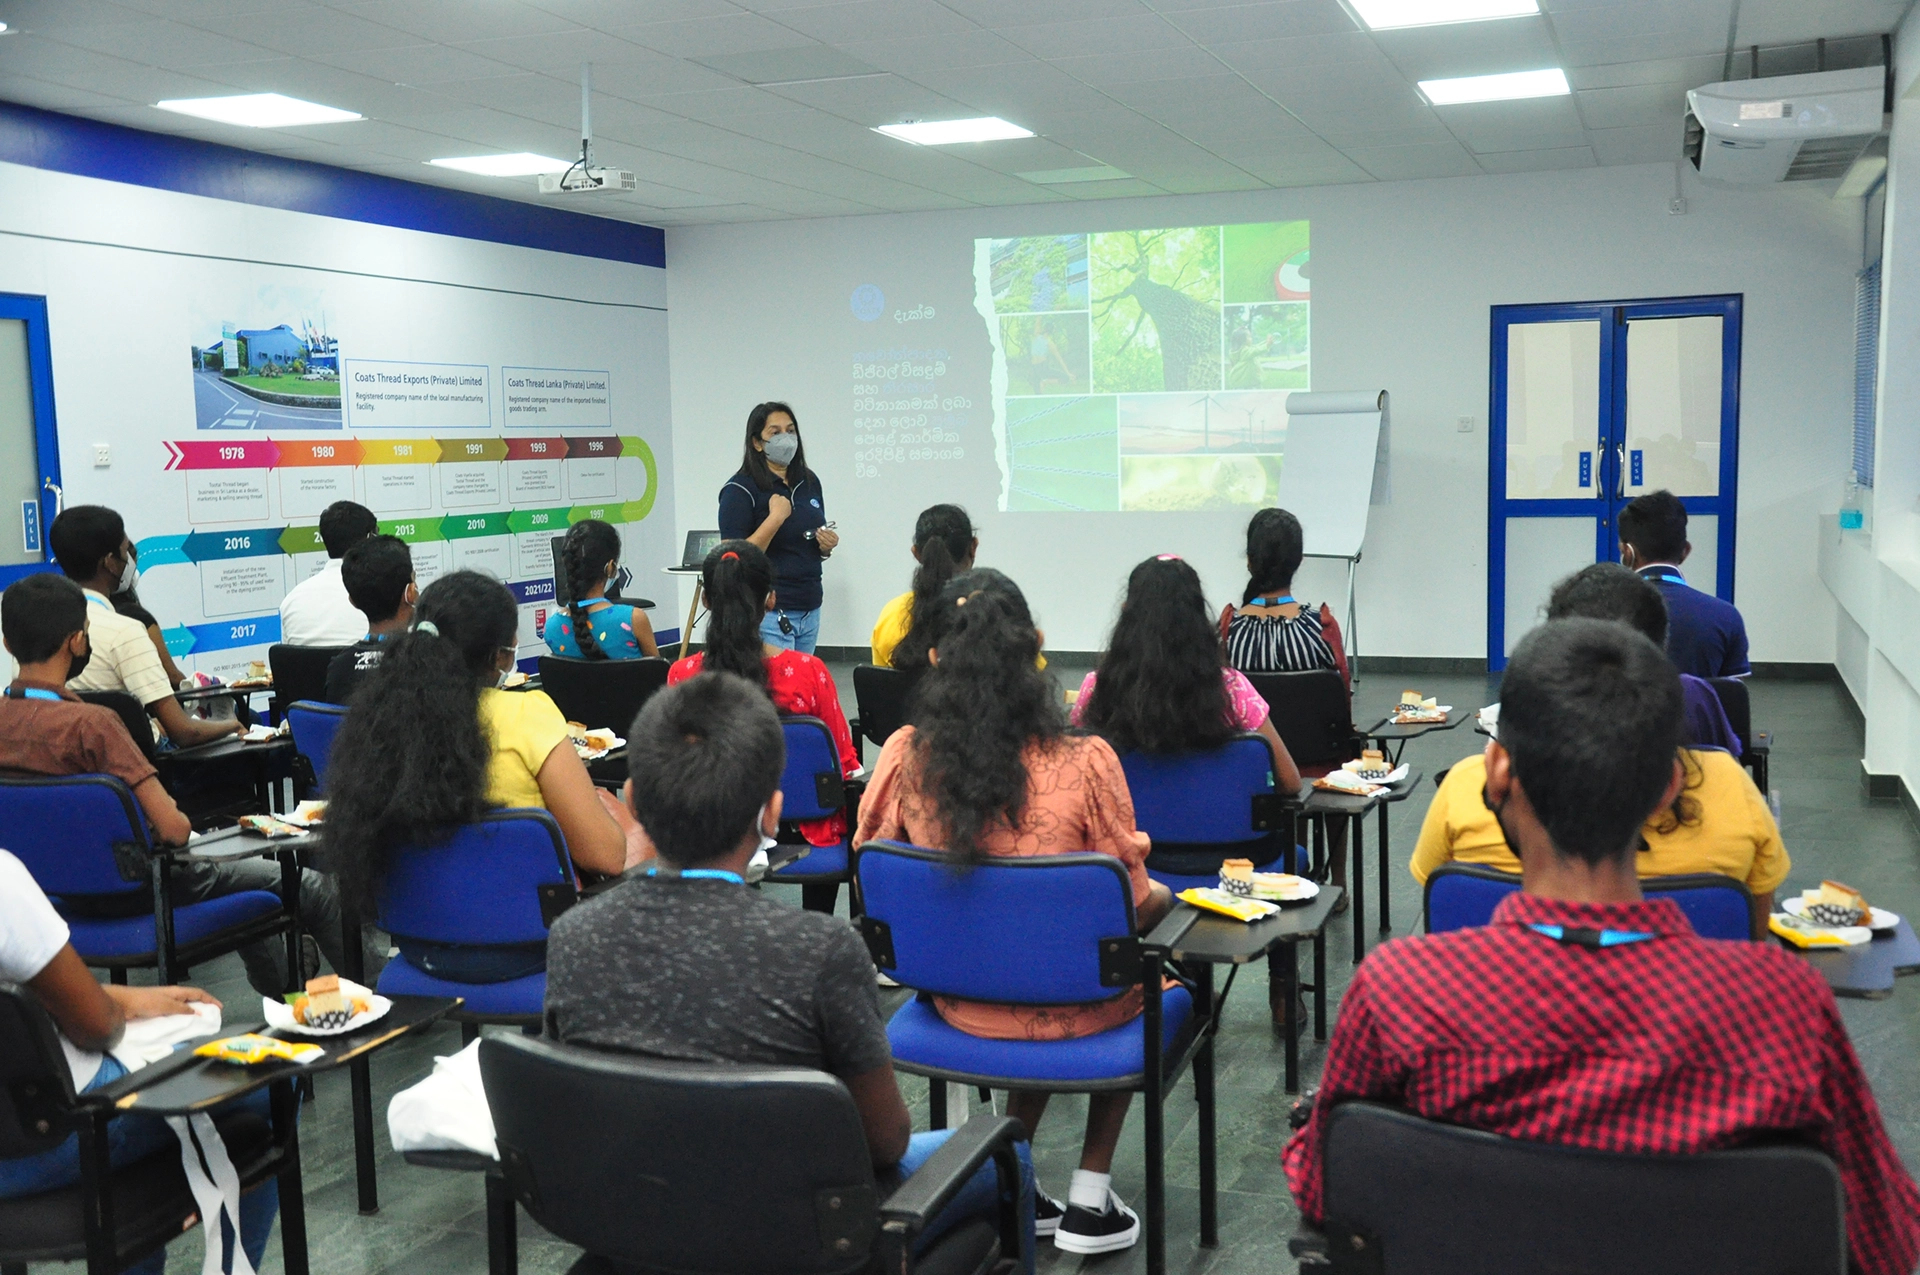
Supporting Learning for Employees’ Children
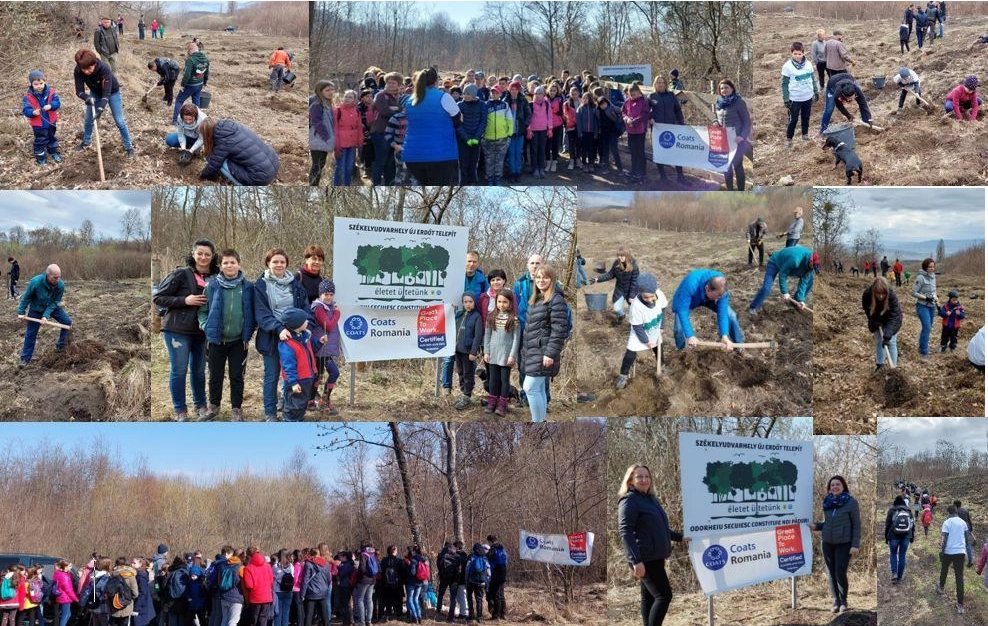
Orizaba, Mexico & Odorhei, Romania
Reforestation
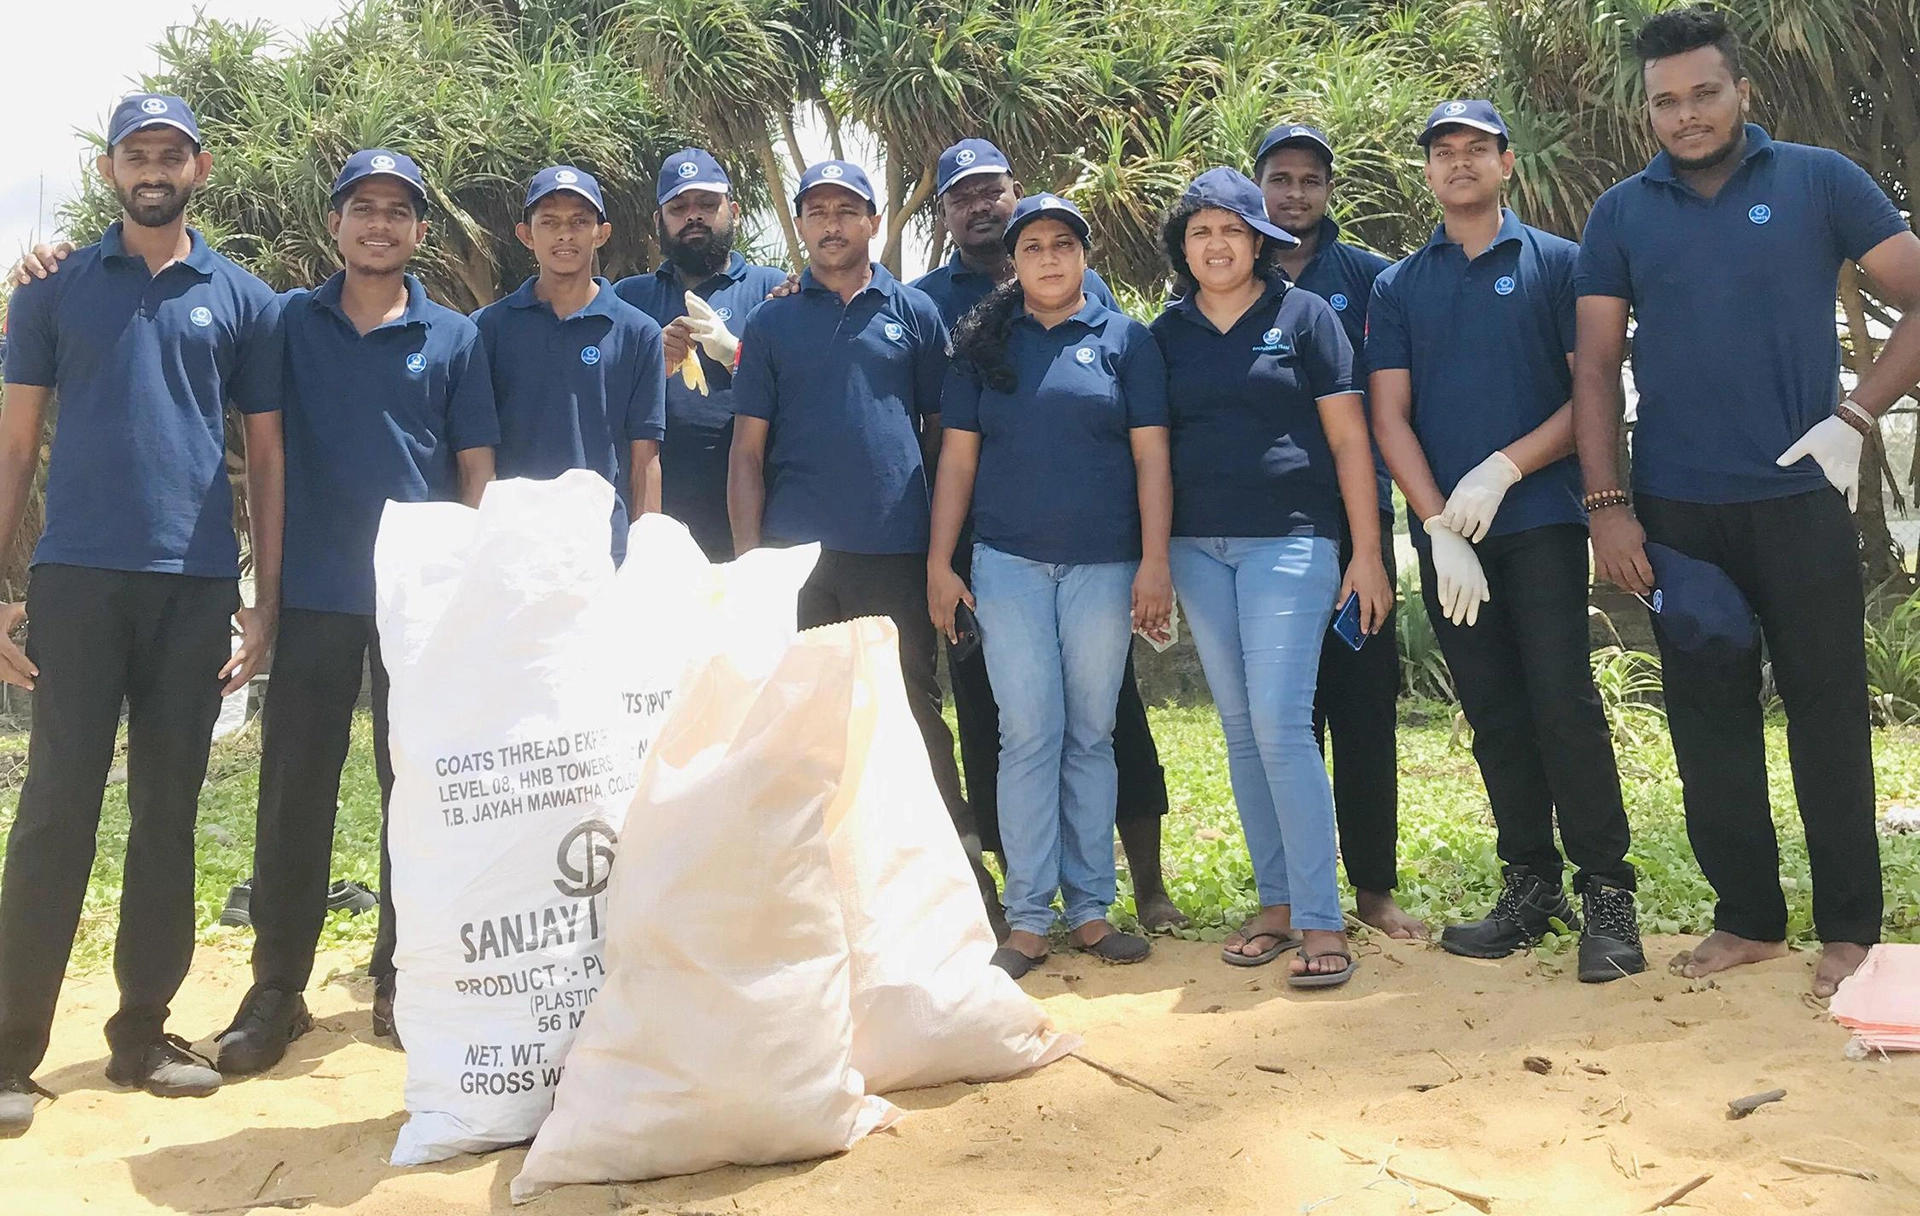
Sri Lanka & Bangladesh
Beach Clear-Ups
Coats Employee Profile
We have a comprehensive suite of policies, procedures and programmes in place to ensure that safety, wellbeing, fairness, equality, diversity and opportunity are an integral part of our relation with our people.
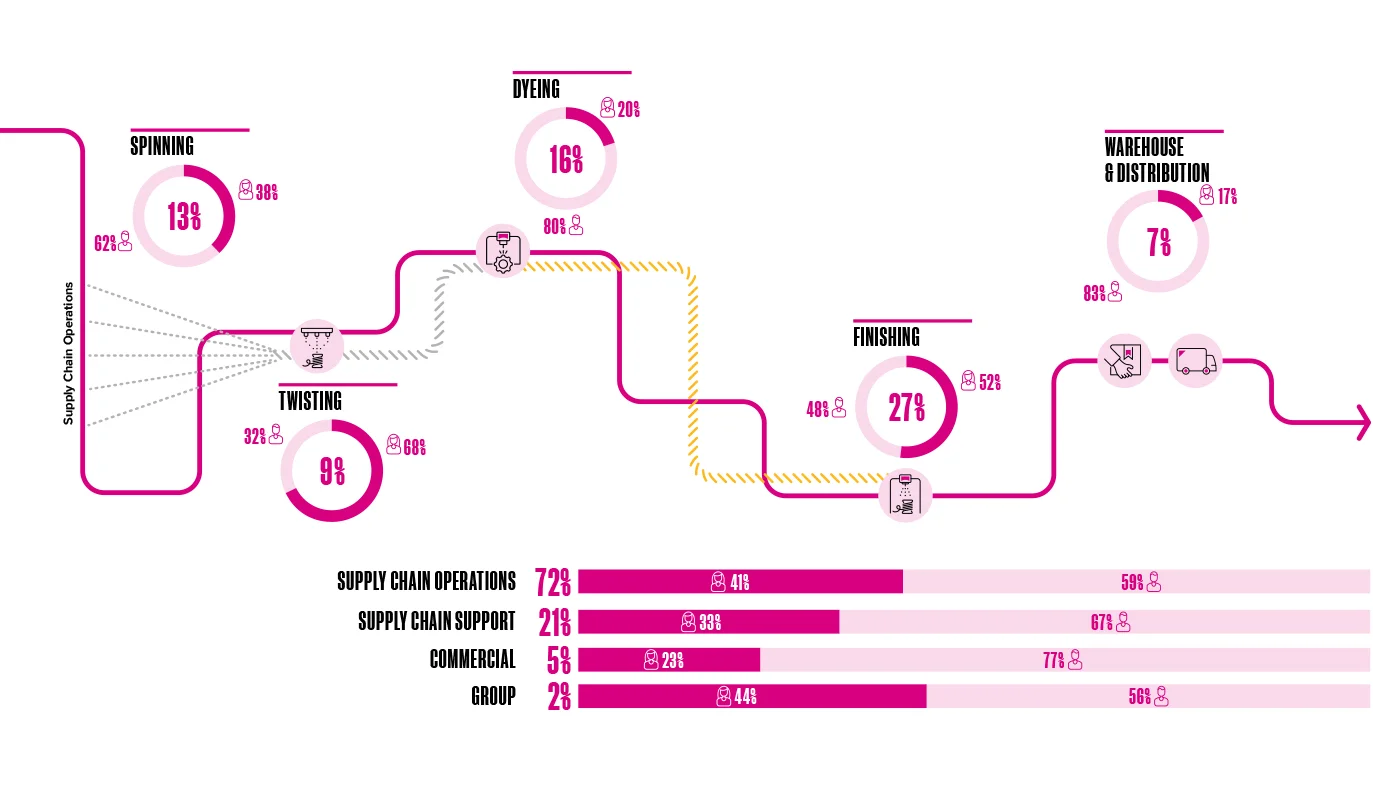
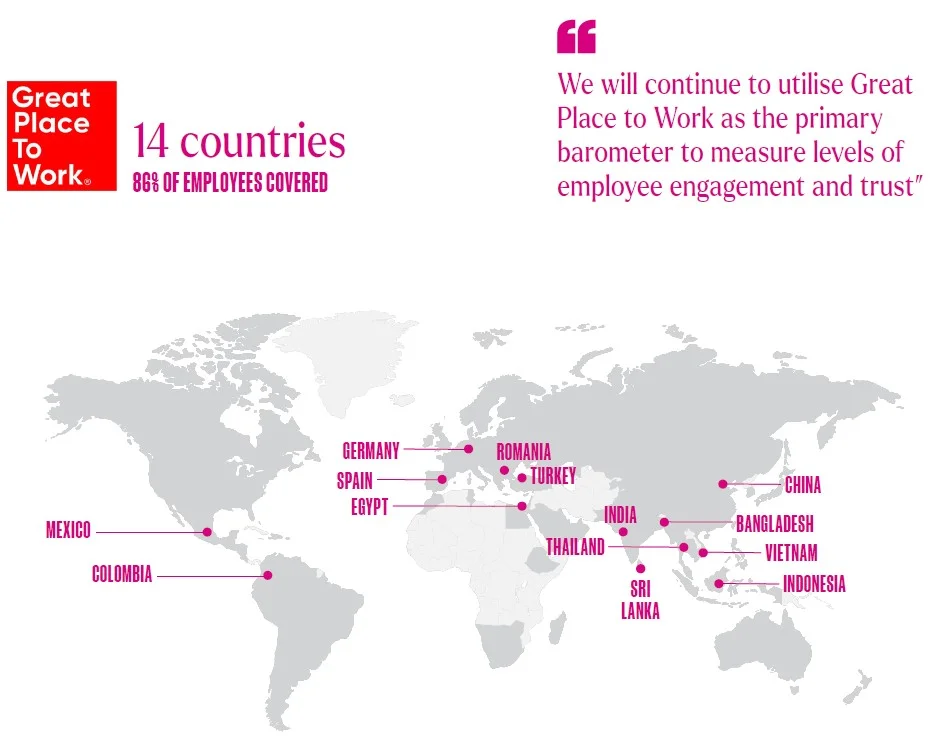
People: 88% employees in units with Great Place to Work certification
|
Indicator
|
Unit | 2022* | 2021 restated1 | 2021 | 2020 restated1 | 2020 | 2019 restated1 | 2019 | 2018 restated1 | 2018 |
|---|---|---|---|---|---|---|---|---|---|---|
|
Permanent
employee headcount7 |
No. | 16,709 | 18,811 | 17,943 | 17,725 | 18,239 | ||||
|
Permanent employee average tenure
|
Years | 10.0 | 9.7 | 10.3 | 11.1 | 10.3 | 10.2 | |||
|
Permanent employee turnover
|
% | 28% | 23% | 20% | 25% | 27% | ||||
|
Permanent employee turnover (voluntary)
|
% | 19% | ||||||||
|
Permanent employee turnover (involuntary)
|
% | 19% | ||||||||
|
Temporary Employee Headcount
|
No. | 3,702 | 4,104 | 3,163 | - | - | ||||
|
% female permanent employees
|
% | 38% | 42% | 42% | 41% | 39% | ||||
|
% female senior managers
|
% | 21% | 23% | 22% | 24% | 23% | ||||
|
% female Board members
|
% | 44% | 50% | 40% | 33% | 30% | ||||
|
Employee engagement score
|
% | N/A | 83% | N/A | N/A | 83% | ||||
|
Safety training
|
Hours/employee | 30 | 29 | 23 | ||||||
|
Sites accredited to OHSAS 18001
|
No. | 5 | 7 | 7 | ||||||
|
Sites accredited to ISO 45001
|
No. | 6 | 5 | 4 | ||||||
|
Near misses reported
|
No. | 1,653 | 1,765 | 1,320 | ||||||
|
Near miss reporting rate
|
No./100 FTE | 6.9 | 6.6 | 6.1 | ||||||
|
Hazards reported
|
No. | 47,369 | 47,400 | 35,083 | ||||||
|
Hazard reporting rate
|
No./100 FTE | 196 | 179 | 162 | ||||||
|
Improvement actions completed
|
No. | 53,389 | 54,228 | 39,689 | ||||||
|
Improvement actions completion rate
|
No./100 FTE | 221.3 | 204.3 | 183 | ||||||
|
Work related incident rate
|
Incidents/100 FTE | 0.4 | 0.45 | |||||||
|
Number of recordable incidents
|
No. | 97 | 120 | 129 | 135 | |||||
|
Average lost days per lost time incident
|
Days | 13.31 | 20.69 | 24.3 | 19.7 | 16.8 | ||||
|
Total lost days from incidents
|
Days | 785 | 1,916 | 1,669 | 1,672 | |||||
|
Lost time case rate
|
Lost time incidents/100FTE | 0.24 | 0.34 | 0.36 | 0.31 | 0.37 | ||||
|
Work related fatalities
|
No. | 0 | 0 | 0 | ||||||
|
Health & safety prosecutions
|
No. | 0 | 0 | 0 | ||||||
|
Commuting incident rate
|
Incidents/100 FTE | 0.38 | 0.37 | 0.37 | ||||||
|
Number of commuting incidents
|
No. | 92 | 98 | 80 | ||||||
|
% workforce with 'Great Place to Work' or equivalent certification
|
% workforce. | 86% | 83% | 6% | ||||||
|
Permanent employees subject to a collective agreement
|
% | 50% | 53% | 46% | 43% | 37% | ||||
|
Permanent employees that are members of a union
|
% | 44% | 40% | 47% | 43% | 38% | ||||
|
Diversity in employees
|
No. of nationalities | 57 | 62 | 60 | 60 | 63 | ||||
|
Diversity in senior managers
|
No. of nationalities | 30 | 32 | 31 | 31 | 32 |
1Due to the sale of our Brazilian and Argentinian businesses in 2022 all years from 2018 to 2022 have been restated to exclude these businesses.
*2022 Data – All data excludes Brazil/Argentina, except emissions data, H&S data and economic value data.
7Permanent headcount includes JV operations in China so the numbers don’t reconcile exactly to the statutory headcount in the Annual Report.
For more information on our historical performance, please download Performance Summary Data
People: 88% employees in units with Great Place to Work certification
|
Indicator
|
Unit | 2017 | 2016 | 2015 | 2014 |
|---|---|---|---|---|---|
|
Permanent
employee headcount7 |
No. | 19,419 | 19,079 | 18,985 | 19,204 |
|
Permanent employee average tenure
|
Years | 10.4 | |||
|
Permanent employee turnover
|
% | 19% | |||
|
% female permanent employees
|
% | 41% | 40% | 41% | 40% |
|
% female senior managers
|
% | 22% | 21% | 19% | 19% |
|
% female Board members
|
% | 30% | 22% | 11% | 13% |
|
Employee engagement score
|
% | 83% | 83% | 83% | 81% |
|
Near misses reported
|
No. | 1,583 | |||
|
Near miss reporting rate
|
No./100 FTE | 5.4 | |||
|
Hazards reported
|
No. | 33,112 | |||
|
Hazard reporting rate
|
No./100 FTE | 114 | |||
|
Improvement actions completed
|
No. | 36,014 | |||
|
Improvement actions completion rate
|
No./100 FTE | 124 | |||
|
Work related incident rate
|
Incidents/100 FTE | 0.56 | 0.56 | ||
|
Number of recordable incidents
|
No. | 163 | 163 | ||
|
Average lost days per lost time incident
|
Days | 34.1 | 17.9 | ||
|
Total lost days from incidents
|
Days | 2,320 | 2,015 | ||
|
Lost time case rate
|
Lost time incidents/100 FTE | 0.24 | 0.26 | ||
|
Work related fatalities
|
No. | 1 | 0 | 0 | 0 |
|
Health and safety prosecutions
|
No. | 0 | 0 | 0 | 0 |
|
Permanent employees subject to a collective agreement
|
% | 38% | |||
|
Permanent employees that are members of a union
|
% | 34% | |||
|
Diversity in employees
|
No. of nationalities | 68 | |||
|
Diversity in senior managers
|
No. of nationalities | 43 |
7Permanent headcount includes JV operations in China so the numbers don’t reconcile exactly to the statutory headcount in the Annual Report.
For more information on our historical performance, please download Performance Summary Data


